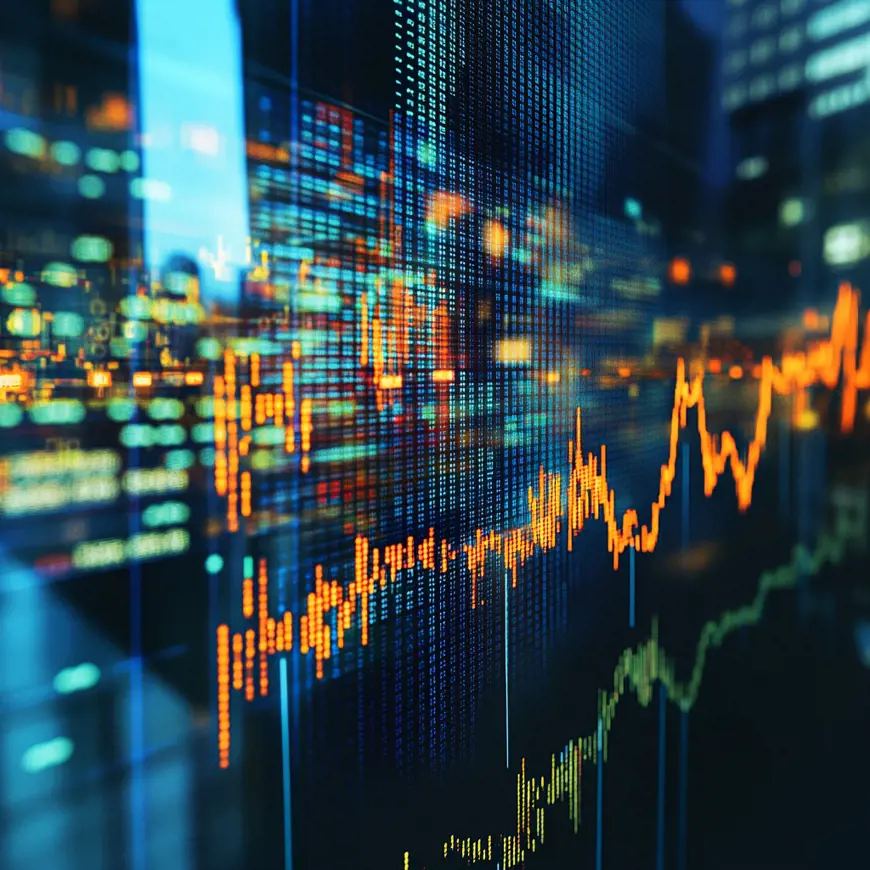
Use Market Metrics to Make Smart Decisions

In the crypto world everything hinges on insight and informed decisions. But how do you know what to look for?

With On The Chain, we help you understand the most important market trends so you can evaluate your crypto investments better. Discover how to use volatility, market capitalization, and other factors to spot opportunities and manage risks. With these tools, you’re always prepared to make strategic choices in a dynamic market.

Scroll down to explore the metrics that make a difference!

Want to know more? Get in touch
Een scherm met daarop een grafiek voor trading

Volatility

How fast does the market move?

Volatility shows how much and how quickly the value of a cryptocurrency can change. High volatility means more opportunity, but also more risk for investors. Cryptocurrencies are known for large price swings, often driven by speculation and news. Understanding volatility helps you make better decisions in this dynamic market. Stay alert—volatility can bring profit or loss!

Learn More About Volatility

Market Momentum

The Speed of Change

Market momentum measures how quickly a cryptocurrency is rising or falling in value. A useful tool for this is the Relative Strength Index (RSI), which helps indicate if a coin is overbought or oversold. With RSI you can recognize potential turning points in the market. For example, an RSI above 70 often signals that a coin is overvalued, while under 30 can suggest a buying opportunity. Use momentum as a guide to enter or exit positions strategically.

Check Market Momentum
Een wand met daarop trading informatie
Een containerschip met veel kleurige containers met het stuurhut in zicht

Trading Volume

How Much Is Being Traded?

Trading volume shows how much activity there is around a cryptocurrency—how often it’s bought or sold. High volume often signals strong interest and often more stability in price movements. Low volume may indicate the market is quiet or uncertain. Combine volume analysis with other indicators to confirm trends and make informed decisions. Trade wisely by observing both volume and price movement..

See Trading Volume Trends


Need help? Contact us

Market Capitalization

The Size of the Market

Market capitalization tells you how large a cryptocurrency is, based on the total number of coins multiplied by the price per coin. Large-market-cap coins, like Bitcoin, are often seen as more stable. Small-cap coins offer more growth potential but also bring more risk. Use market cap to better understand both risk and opportunity of a coin. Choose wisely based on your own investment goals.

View Market Cap Data
een stapel bitcoins en andere munten op bankbiljetten
Een bovenaanzicht van een taart met daarop crypto tekens

Bitcoin Dominance

Who leads the market?

Bitcoin dominance measures Bitcoin’s share in the total value of the cryptocurrency market. High dominance means Bitcoin is controlling the market; lower dominance may point to an “altcoin season,” when smaller coins gain more attention. Investors use dominance to identify where opportunities lie—Bitcoin or alternative coins. Monitor dominance to recognize market trends.

Track BTC Dominance

Fear and Greed Index

Fear or greed?

The Fear and Greed Index measures market sentiment: is there fear, or is there greed? Low scores often reflect fear and falling prices, while high scores may signal an overheated market. Use this index to time buying or selling. Buy when others are fearful and sell when the market is greedy. Emotions frequently shape markets, and this tool helps you leverage them smartly..

Check Fear & Greed Levels


Questions? Book a call
Tweetal smiley gezichten op een een balans
Een stapel documenten op een buro met een laptop vervaagd in de achtergrond.

Open Interest

Who’s Holding Positions?

Open interest shows how many active contracts there are in futures and options markets. Rising open interest along with rising prices may signal a strong market; falling interest may suggest weakness. Use this indicator to see how much activity and interest there is in the market and combine it with price actions to better judge whether a trend may continue.

Analyze Open Interest

Funding Rates

The cost of your position?

Funding rates in the crypto market determine payments between long and short positions. Positive rates signal demand for longs and bullish sentiment, whereas negative rates show the opposite. These rates help keep futures and spot prices aligned. For traders, high funding rates can increase costs or eat into profits. Monitor funding rates to make more informed decisions.

See Funding Rates
Twee handen die een stapel dollars uitwisselen
Een digitale kaart van de wereld met de kleuren blauw en oranje

Google Trends

What are people searching for?

Google Trends shows how popular certain search terms are—such as “buying Bitcoin.” An increase in search interest can point to rising demand and potentially price increases. A decrease may indicate falling interest. Use search trends as an extra indicator of market sentiment. Combine trends data with other metrics for a full picture of the market..

Explore Google Trends


We can help. Plan a call

Ethereum Dominance

How influential is Ethereum?

Ethereum dominance shows Ethereum’s share of total value among all cryptocurrencies. It reflects Ethereum’s influence compared to other projects, including Bitcoin. Rising dominance can signal trust in smart contracts and decentralized applications, while falling dominance may hint at growing interest in altcoins. Investors use this metric to detect trends and improve portfolio decisions.

Track ETH Dominance
Een bovenaanzicht van een taart met daarop crypto tekens
Een wereldbol waarop markten en data stromen zichtbaar zijn

On The Chain Market Index

One number for the full market picture

The On The Chain Market Index combines several market metrics into one convenient score. With values between 0 and 100, the index reflects the overall health and trends of the crypto market. High scores indicate strong momentum, while low scores suggest caution. Use the index to quickly gauge the market situation and refine your strategy.

Check the OTC Market Index

On The Chain Season Index

Bitcoin or Altcoins?

Met de On The Chain Seizoen Index weet je of de markt zich in een Bitcoin-seizoen, een Altcoin-seizoen of een neutrale fase bevindt. Hoge Bitcoin-dominantie wijst op stabiliteit, terwijl een sterke Ethereum-dominantie kansen biedt voor altcoins. Deze index helpt beleggers om te bepalen waar de marktfocus ligt en hoe ze hun strategie daarop kunnen afstemmen. Of je nu kiest voor stabiliteit of diversificatie, deze tool geeft je waardevolle inzichten.

View the Season Index


Do you want to be in control? Let's talk
Een munt met aan de linker kant bitcoin en de rechter kant ethereum