Questions About Market Metrics

Here you’ll find answers to some of the most common questions about tracking your crypto investments and market statistics. Because there is a lot of information, we have a separate section on our website where you can find more detailed explanations of the different indices: Balance your Crypto.

Learn how to interpret the various metrics to better understand the market situation and refine your strategies. Our dashboard provides a comprehensive overview of important indicators like the Fear & Greed Index, Bitcoin Dominance, and the On The Chain Market Index. If your question isn’t here, feel free to contact us via the support form.

What are the Market Metrics on the dashboard?

The Market Metrics on our dashboard give an overview of the key indicators within the crypto market. They help you understand the current market situation and make informed decisions.

How are the Market Metrics calculated?

Each metric is calculated based on market data from several reliable sources. Some metrics, such as the Fear & Greed Index and the Google Trends Index, are made up of multiple factors, while others are taken directly from market data like trading volumes and capitalization.

How can I use this data for my strategy?

By combining different metrics, you can get a better picture of the market situation. For example:


  • High Bitcoin Dominance may indicate a weak altcoin market.

  • A low Fear & Greed Index may be a buying opportunity when the market is panic-stricken.

  • Rising Google Trends Index could signal increasing retail interest.

Want more insight into how to use this data for your portfolio? Check out our full guide in Balance your Crypto.

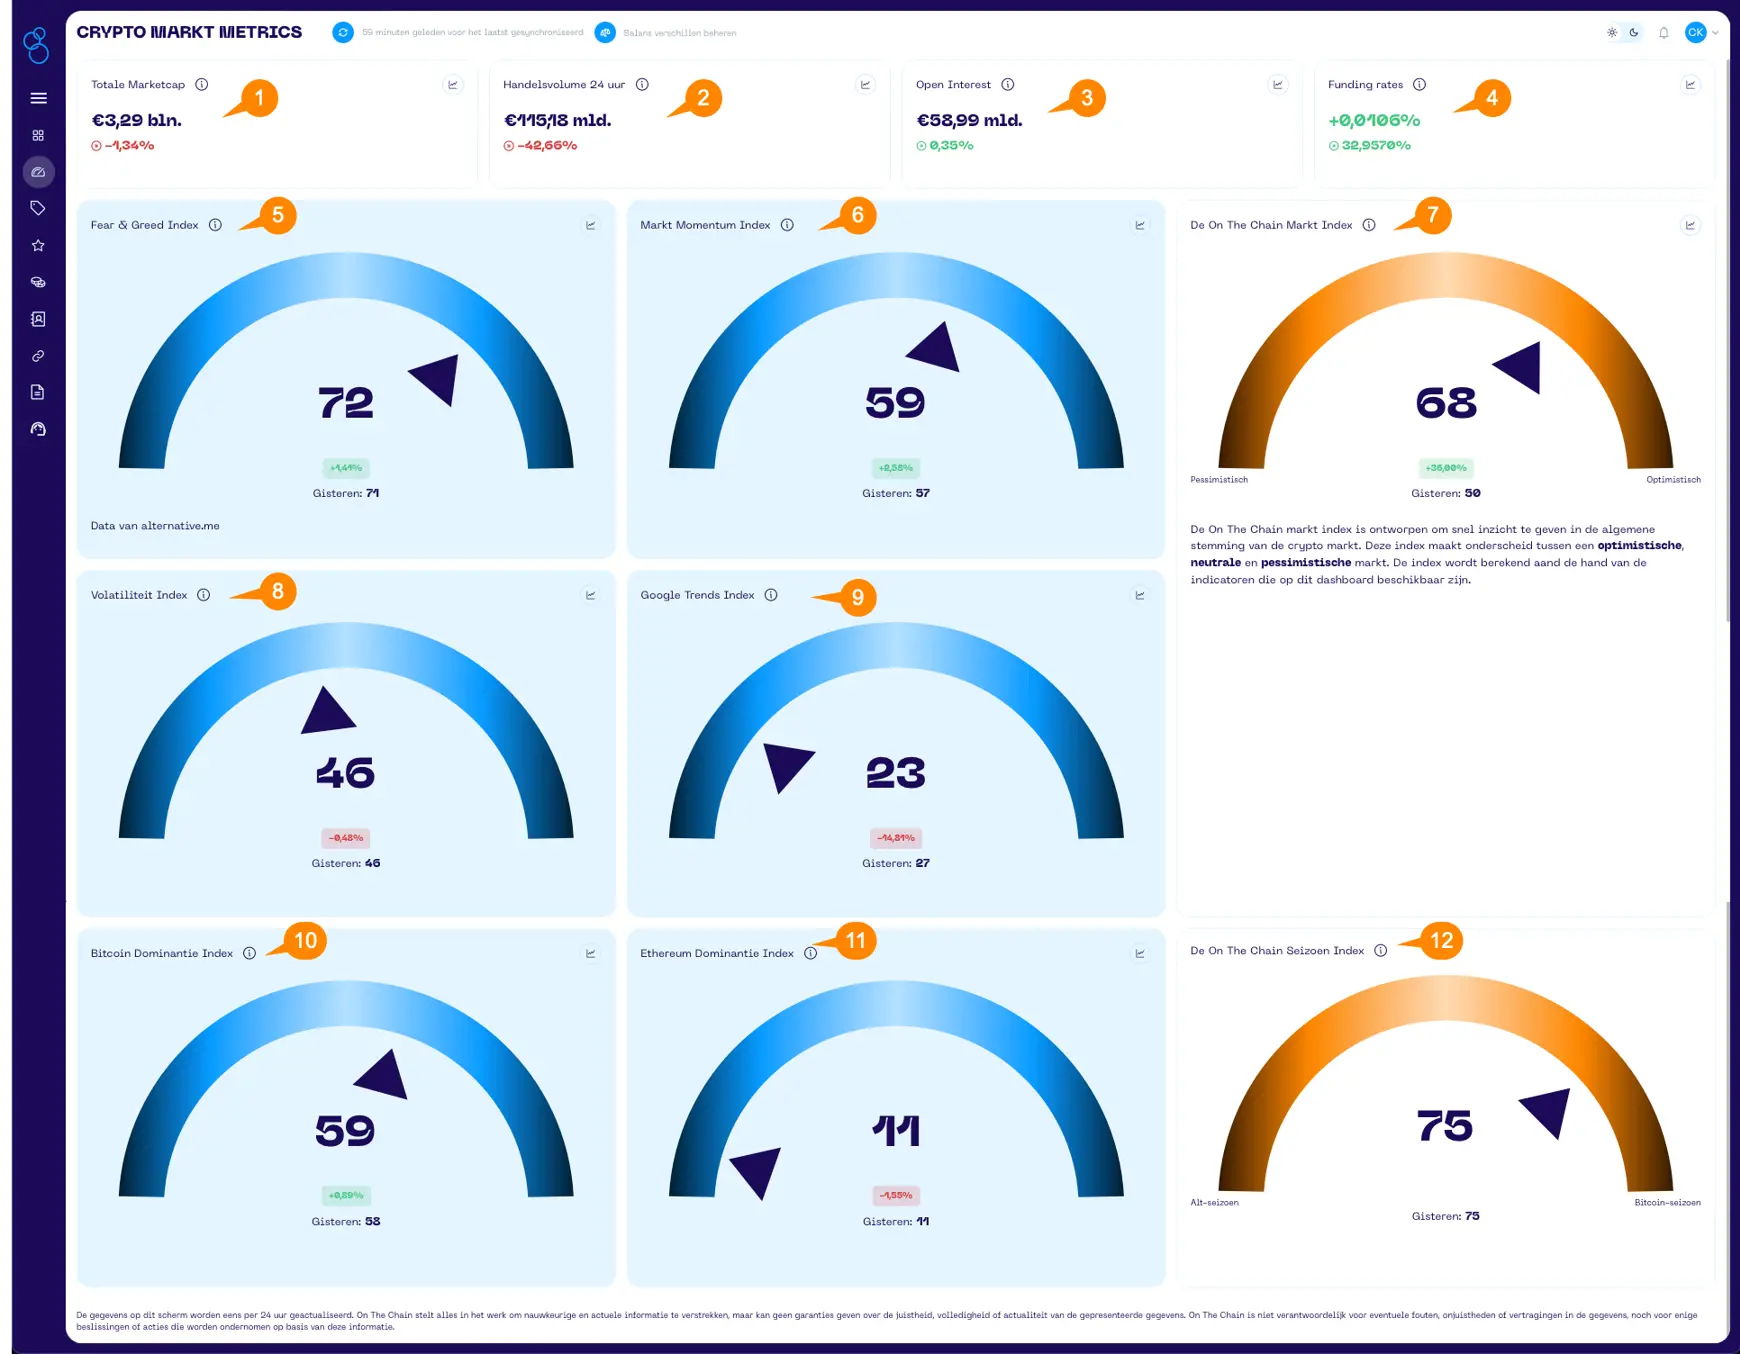
Market Metrics screen

1. Total Market Capitalization

  • Indicates the total value of the crypto market.
  • Declines may signal lower confidence or selling pressure.

2. 24-Hour Trading Volume

  • How much has been traded in the past 24 hours.
  • A drop can mean reduced market interest.

3. Open Interest

  • Measures how much capital is tied up in derivatives like futures.
  • Rises suggest more speculation and market activity.

4. Funding Rates

  • The cost to hold a futures position.
  • Positive values suggest bullish sentiment; negative values suggest bearish.

5. Fear & Greed Index

  • A psychological indicator that measures market sentiment.
  • High values = greed, low values = fear.

6. Market Momentum Index

  • Measures the strength of recent price movements.
  • An increase often signals a persistent trend.

7. On The Chain Market Index

  • A unique index that summarizes market sentiment.
  • Helps in distinguishing between optimistic, neutral, and pessimistic markets.

8. Volatility Index

  • Measures price fluctuations in the market.
  • A high score points to a turbulent market.

9. Google Trends Index

  • Measures search interest in crypto-related topics.
  • A drop may signal decreased public interest.

10. Bitcoin Dominance Index

  • How large Bitcoin’s share is in the total market.
  • An increase means altcoins are less dominant.

11. Ethereum Dominance Index

  • How large Ethereum’s share is in the market.
  • Useful for monitoring DeFi and NFT sectors.

12. On The Chain Season Index

  • Determines whether the market is in an “Altcoin Season” or a “Bitcoin Season.
  • Helpful for strategic adjustments in portfolios.
John-Paul Straver

John-Paul Straver